
BetterBirth Report Addendum: Special Topics on Complication Management
Like referral, the availability of cesarean deliveries (“c-sections”) are a critical part of the continuum of care for women and newborns with complications.
A handful of facilities participating in the BetterBirth Study had c-section capability, while most relied on referral for those women who needed c-sections. In all study facilities, care was technically available 24 hours a day, seven days a week, including the capability for c-sections at designated Community Health Centers and First Referral Units.
There is debate within medical and public health communities on the optimal frequency of c-section within a given population, but an average of 19 c-sections per 100 live births is viewed as ideal to reduce maternal and neonatal mortality.8 In reality, India’s c-section rates vary from 3% to 70% depending on region and socioeconomic status. The average c-section rate from 2016 was 17.2%.9
Beyond the overall c-section rate, we looked at two additional factors around c-section: timing of delivery and c-sections performed on stillbirths. We wanted to understand patterns of c-sections at different times of day to better understand if this intervention was consistently available 24 hours per day. For all deliveries in the study, we found that the median time from admission to delivery was 105 minutes.
C-sections are not recommended in the case of stillbirth due to the increased risk for the woman, and stillbirth rates remain high in India (23 per 1,000 births in 2015).2,10,11 Analyzing trends of stillbirth within c-section in the BetterBirth study will help in understanding the trends in this population.
Findings
Learnings about process
In general, the BetterBirth study took place in a low c-section environment: C-section deliveries comprised only 1.8% of births studied (~2,800 out of ~160,000). Moreover, 91% of cases requiring c-section in the trial were referred.

To further explore this insight, we analyzed c-section timing—that is, the time of day the deliveries occurred and the median length of time between admission and delivery at different times of day. The analyses (see Figures 4 and 5) revealed that the overwhelming majority of c-sections occurred between 8 a.m. and 2 p.m. at study facilities—a time that facilities are typically better staffed. The median length of time between admission and delivery was also very similar for vaginal deliveries and c-sections during this shift.
Figure 4. Patterns of referral and cesarean deliveries by time of day
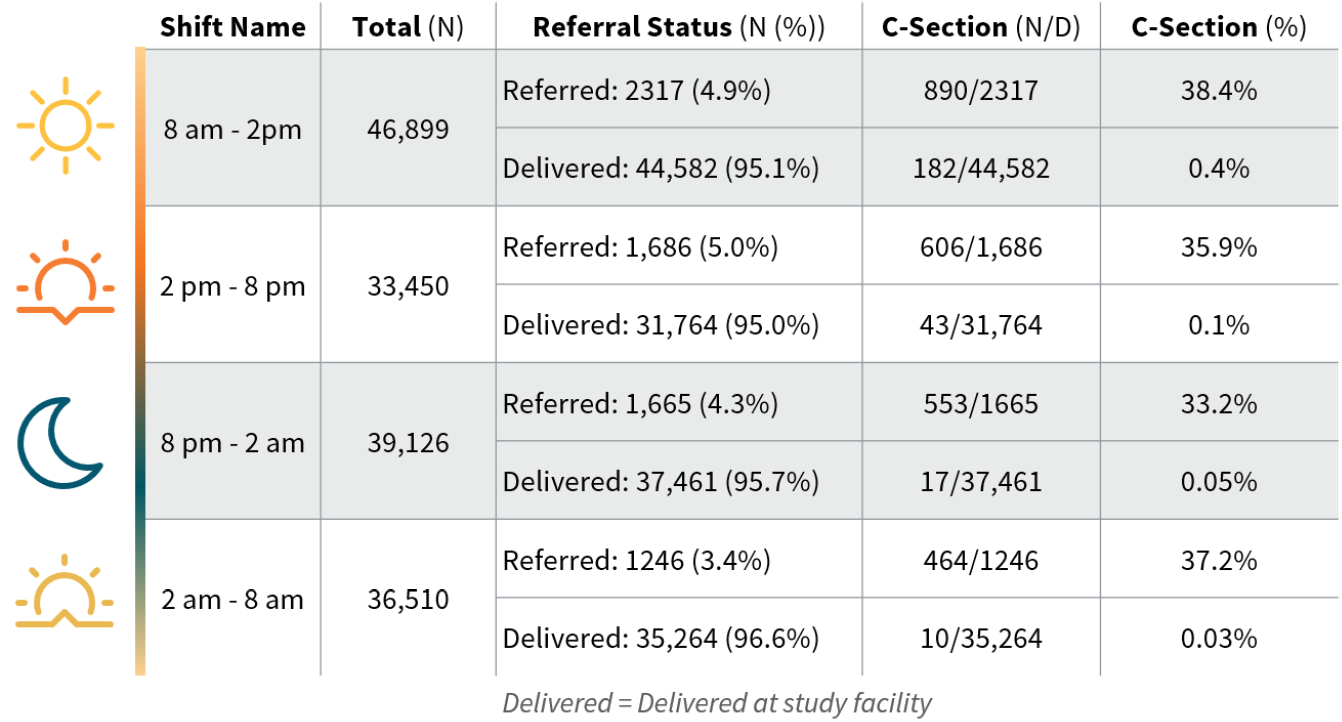
Figure 5. C-section rates by time of arrival (excluding referrals)
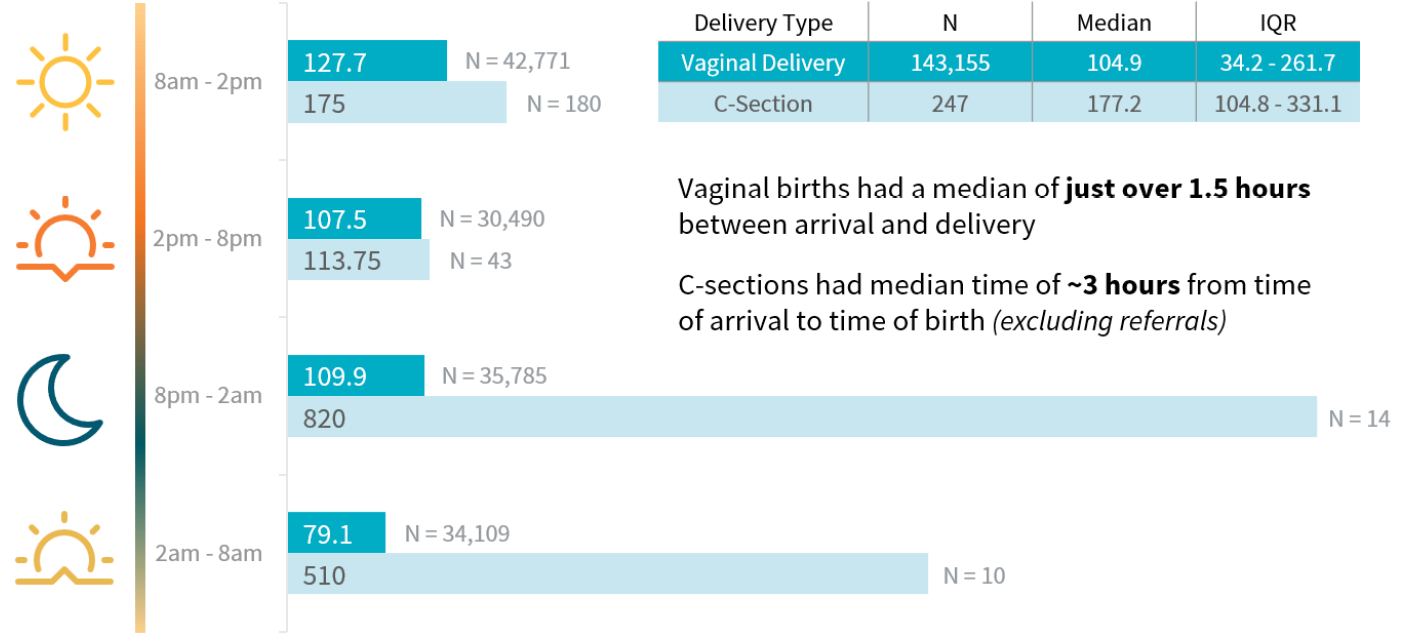
Conversely, the median length of time between admission and delivery was dramatically longer for c-sections compared with vaginal deliveries during overnight shifts: Between 8 p.m. and 2 a.m., the median time from admission to delivery for vaginal deliveries was 109 minutes (~2 hours) whereas it was 820 minutes (~14 hours) for cesarean deliveries. The wait time for the 8 p.m. to 2 a.m. shift was roughly 13 hours, and the wait time during the 2 a.m. to 8 a.m. shift was roughly 8 hours, meaning those deliveries ultimately happened during the morning shift.
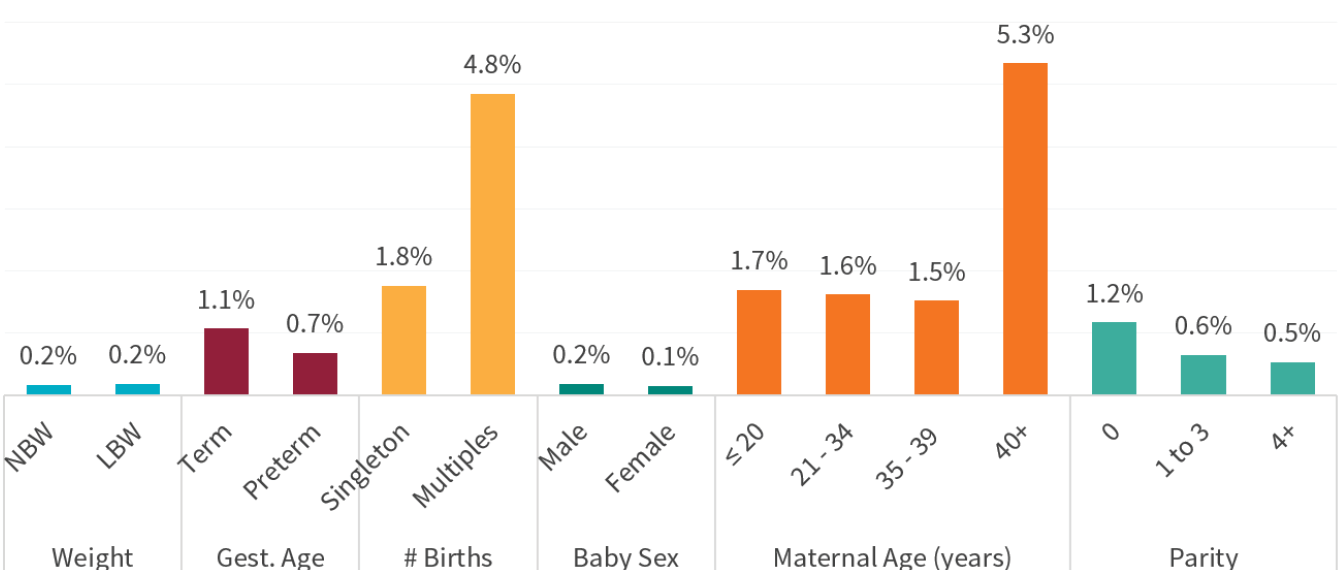
Finally, we looked at the characteristics of patients who had a cesarean delivery and found that twins and women over 40 had the highest proportions of c-section deliveries.
Figure 6. Percentage of women who had a cesarean delivery, by core characteristics
Learnings about health outcomes
We found that c-section on a confirmed stillbirth was rare (Table 2); as is consistent with recommendations.
Table 2. C-section and stillbirth
| Delivery Type | Total (N) | Stillbirth (N) | Stillbirth (%) | 95% CI | P-value |
|---|---|---|---|---|---|
| Vaginal Delivery | 153,176 | 2,912 | 1.9% | 1.8% – 2.0% | <0.0001 |
| C-section | 2,481 | 5 | 0.2% | 0.02% – 0.4% |
In looking at the relative risk of perinatal mortality among women who had a c-section delivery versus not, similar to the findings on referral, we could discern a reduced risk of perinatal mortality for c-section delivery of twins, but an increased risk of perinatal mortality for singleton birth. There is not, however, the same pattern related to birth weight.
Figure 7. Risk of perinatal mortality among infants delivered via cesarean compared with vaginal births, by core characteristics
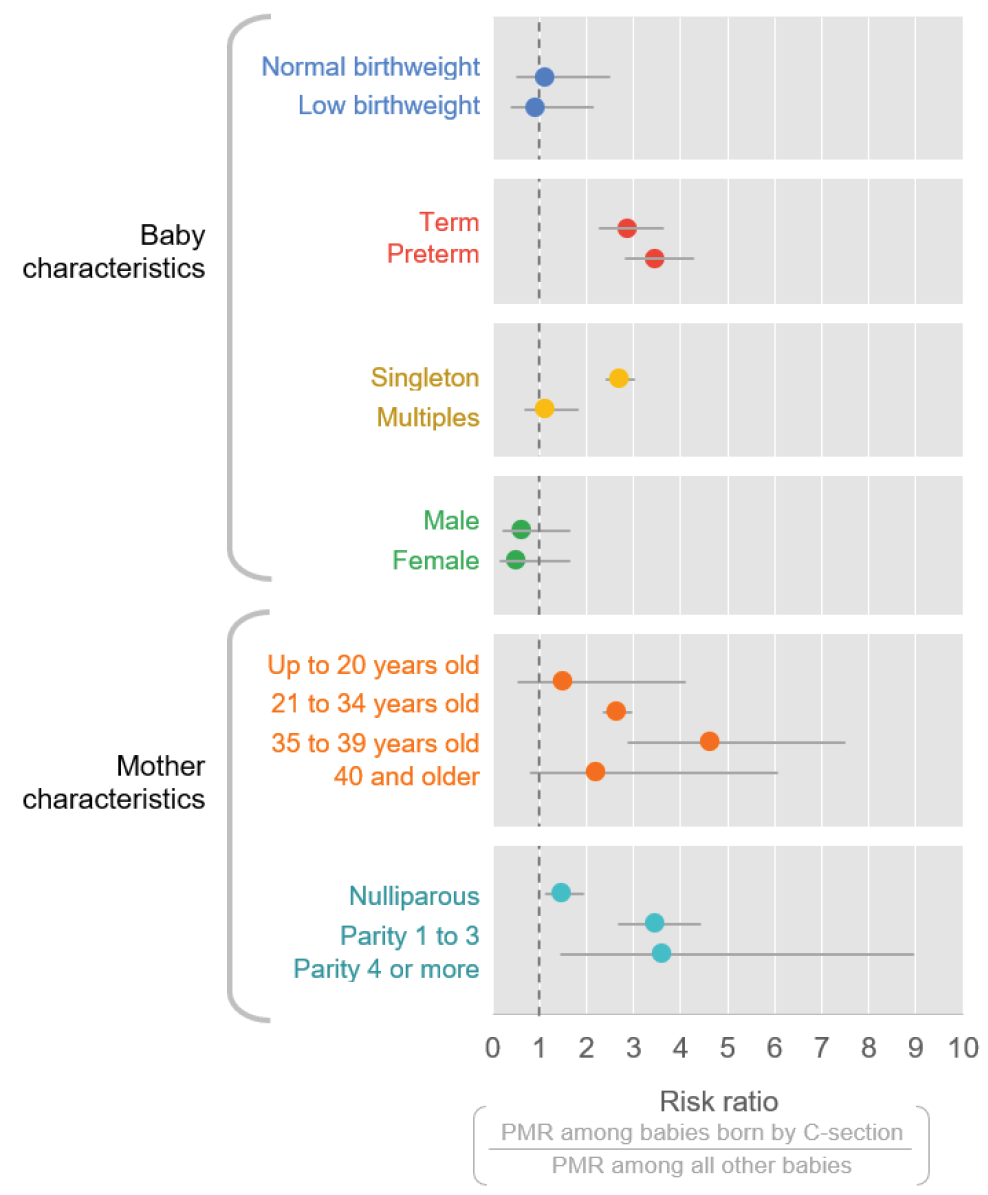
Viewed in combination (Figure 3 on referral and Figure 7 on c-section), it may be that patients who are referred, but ultimately do not receive a c-section, may be at the highest risk of perinatal mortality. The risk of perinatal mortality may be higher for women undergoing c-section who have previously delivered children, although the overlapping 95% confidence intervals suggest that further exploration is needed to understand this relationship. ■