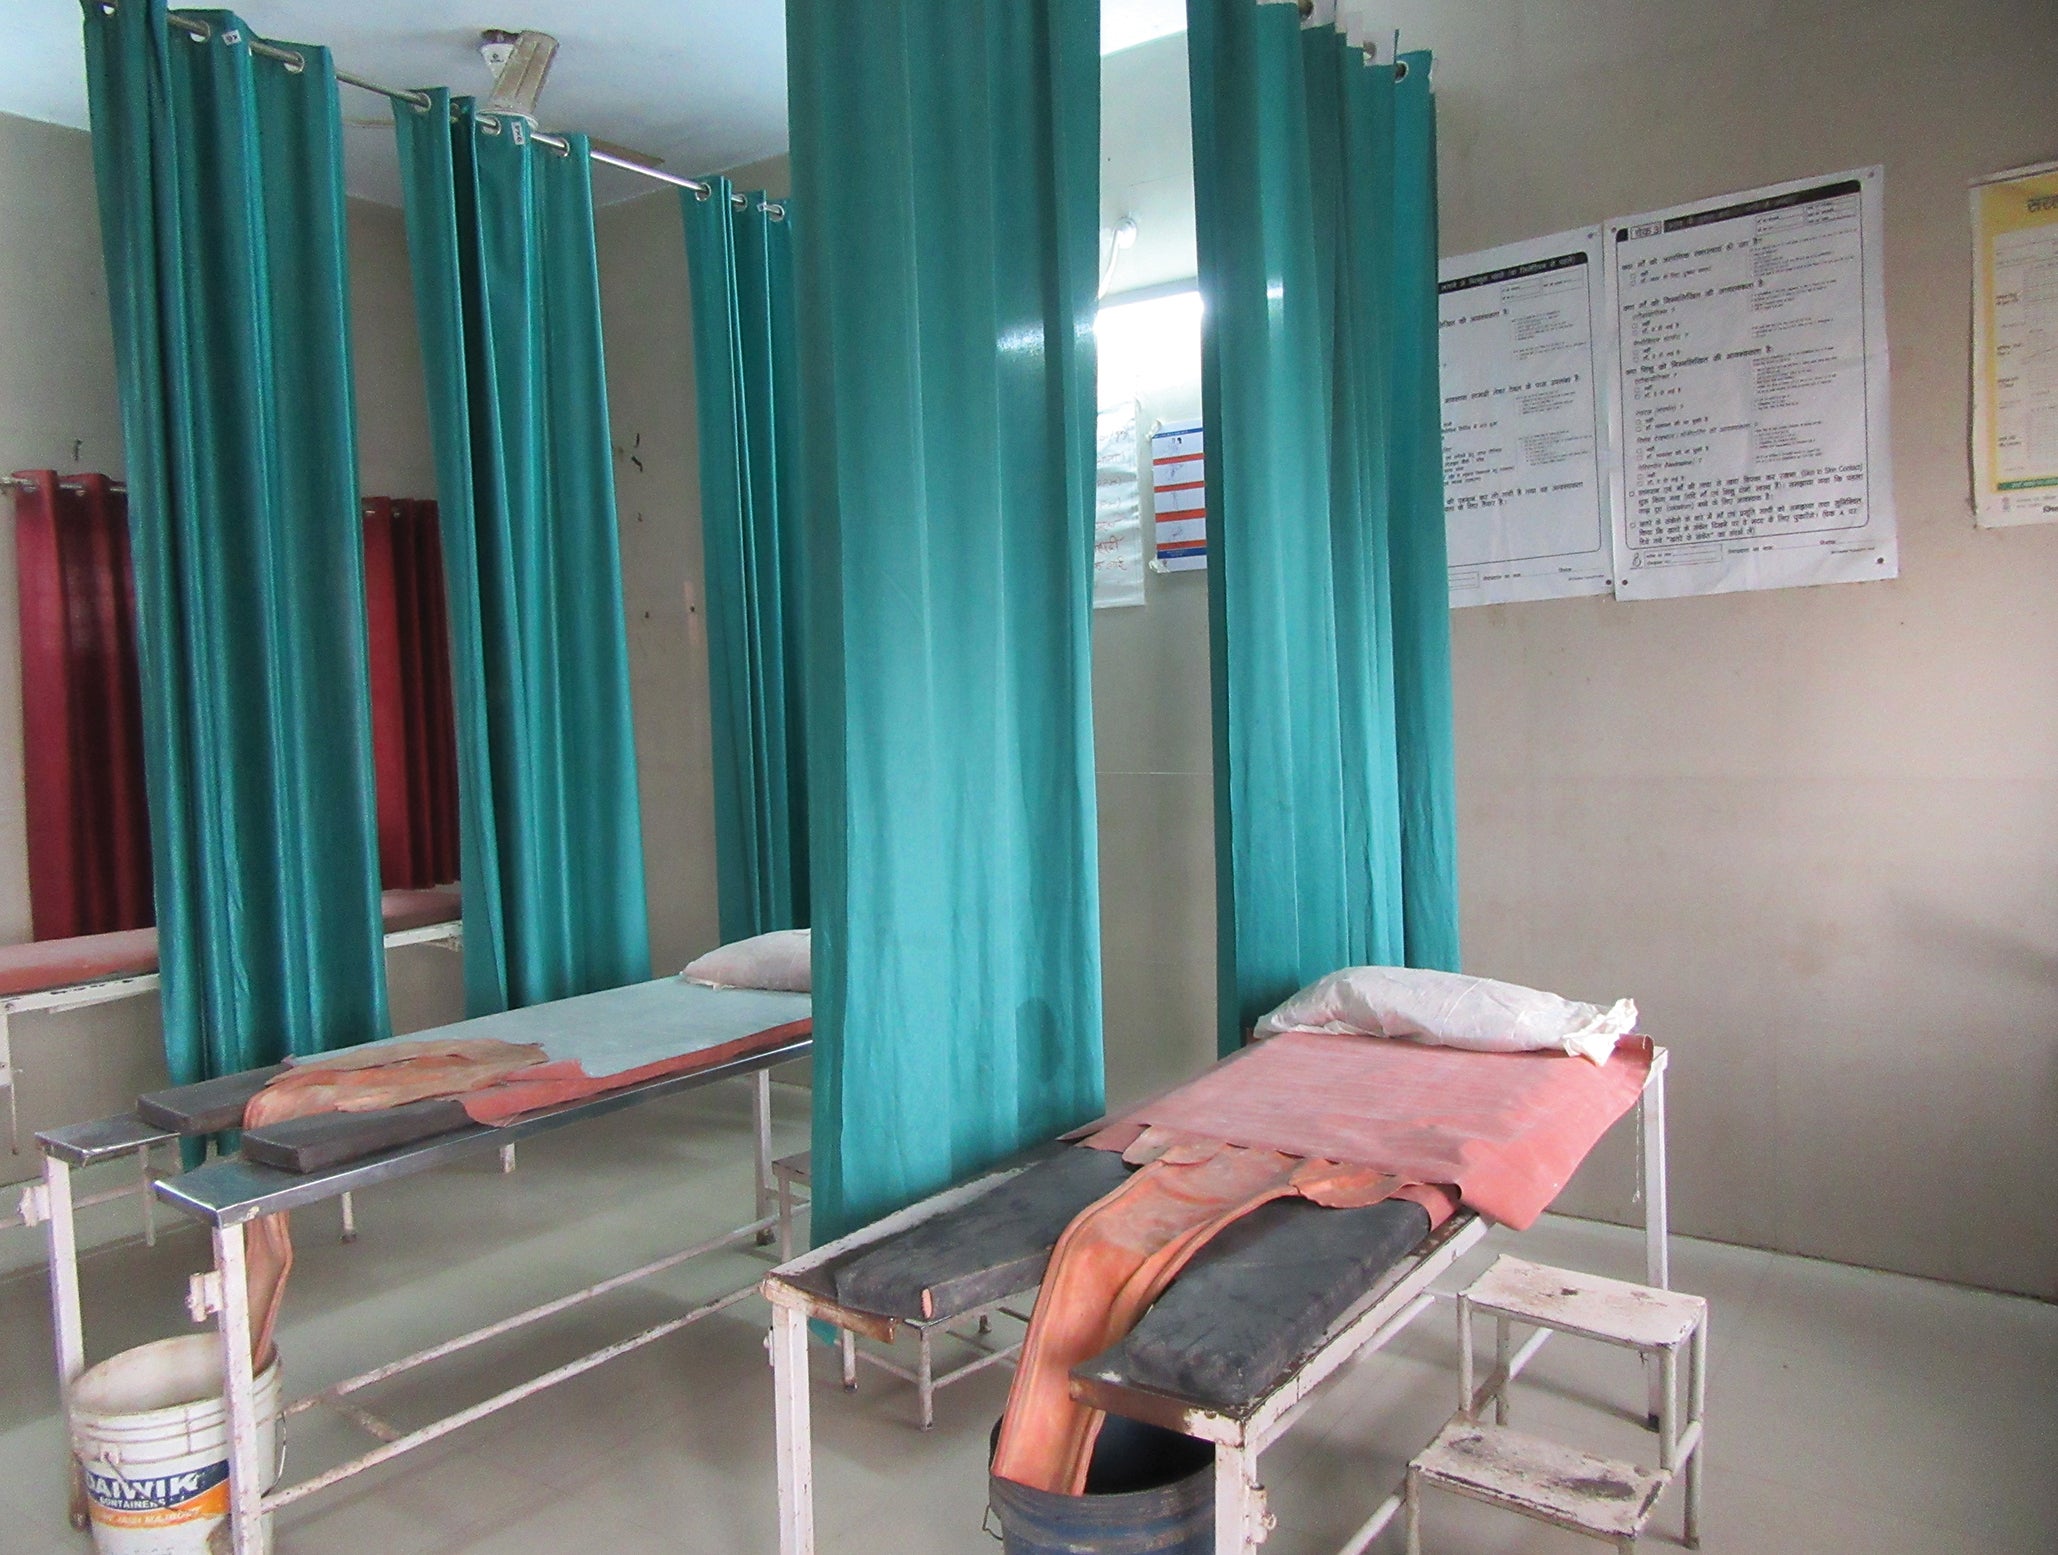
The physical and organizational environment in which women and birth attendants interact profoundly affects the provision and experience of care.
The BetterBirth Study yielded important clues about how quality care breaks down and what questions need to be answered at the health facility level to improve health outcomes.
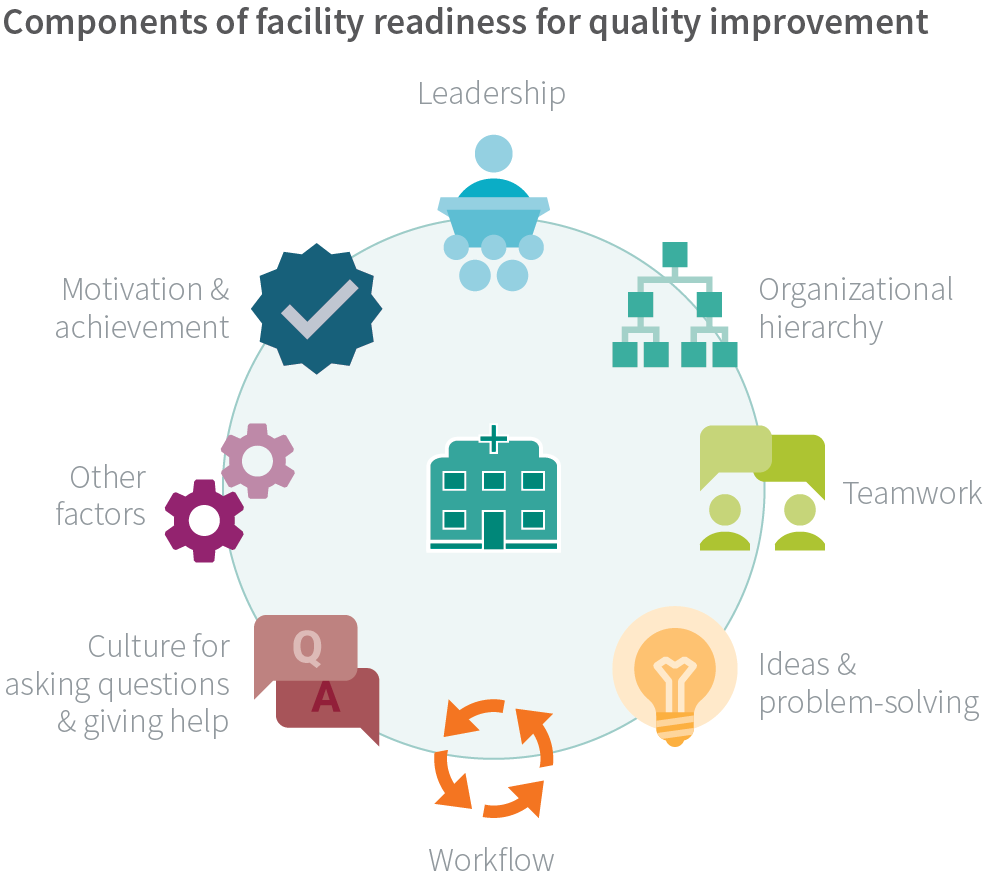
Above all, the study revealed that a facility’s readiness for quality improvement goes beyond traditional measures, such as supply availability and birth attendant staffing. Readiness refers to a site’s ability to implement a quality improvement intervention with respect to a multitude of factors that impact implementation success.
These factors include leadership commitment to quality improvement, positive organizational culture including teamwork and motivated staff, quality-improvement experience and implementation expertise, and other contextual factors that together nurture or thwart a supportive environment for delivering high-caliber care. Sites can vary in their degree of readiness across the factors; they can be highly ready for quality improvement on some dimensions and less ready on others.
Readiness is not just about being ready to implement a new program; rather, it’s about readiness for each stage of the implementation. For example, it is critical to understand there is a learning curve and additional cognitive load for staff participating in a new quality improvement project. Managers should recognize and account for this added cognitive load along with the regular workload when preparing for implementation.
BetterBirth Facilities
In Uttar Pradesh, government-run facilities are the most common location for childbirth, accounting for 45% of births. By comparison, 32% of births take place in homes, and 23% in private facilities.14
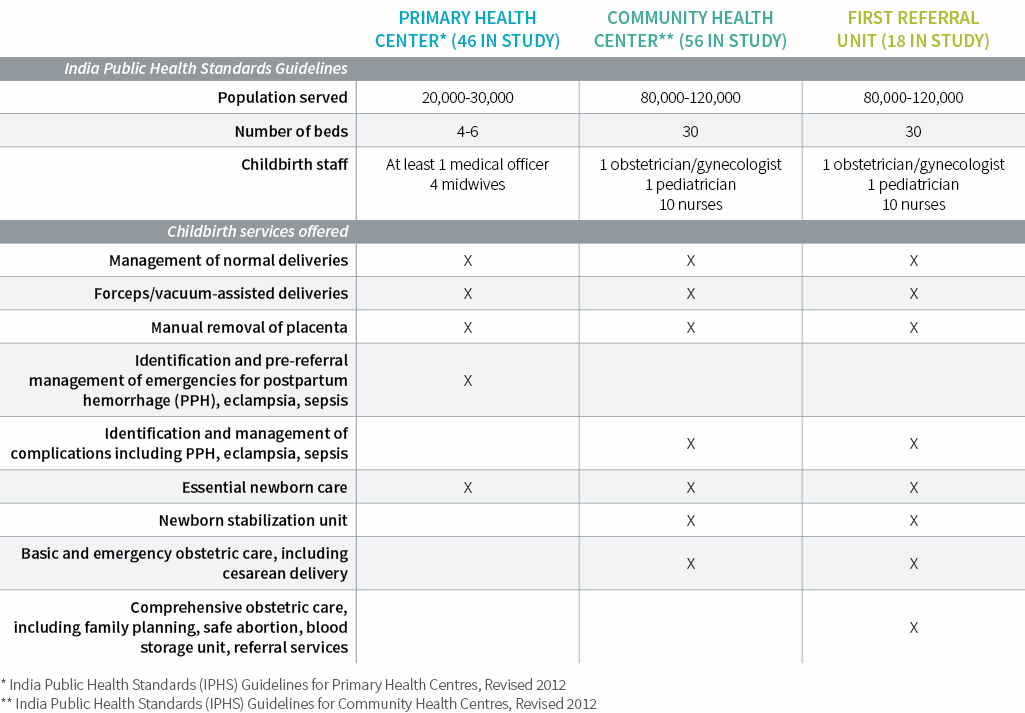
The BetterBirth Study was conducted in 120 primary health centers, community health centers, and first-referral units. Each facility delivered about 1,600 newborns per year (~4 to 5 births per day). An average of four skilled birth attendants were assigned to each facility, one to two of whom were present during each shift.
Outwardly, frontline facilities shared key characteristics—delivery load, staffing, supply availability—and offered very similar childbirth services. All were open 24/7. Among all women in the study, only 2% had a cesarean delivery—the vast majority of which were conducted outside study facilities and in hospitals. This low cesarean delivery rate points to the capacity limitations in providing comprehensive emergency obstetric care.
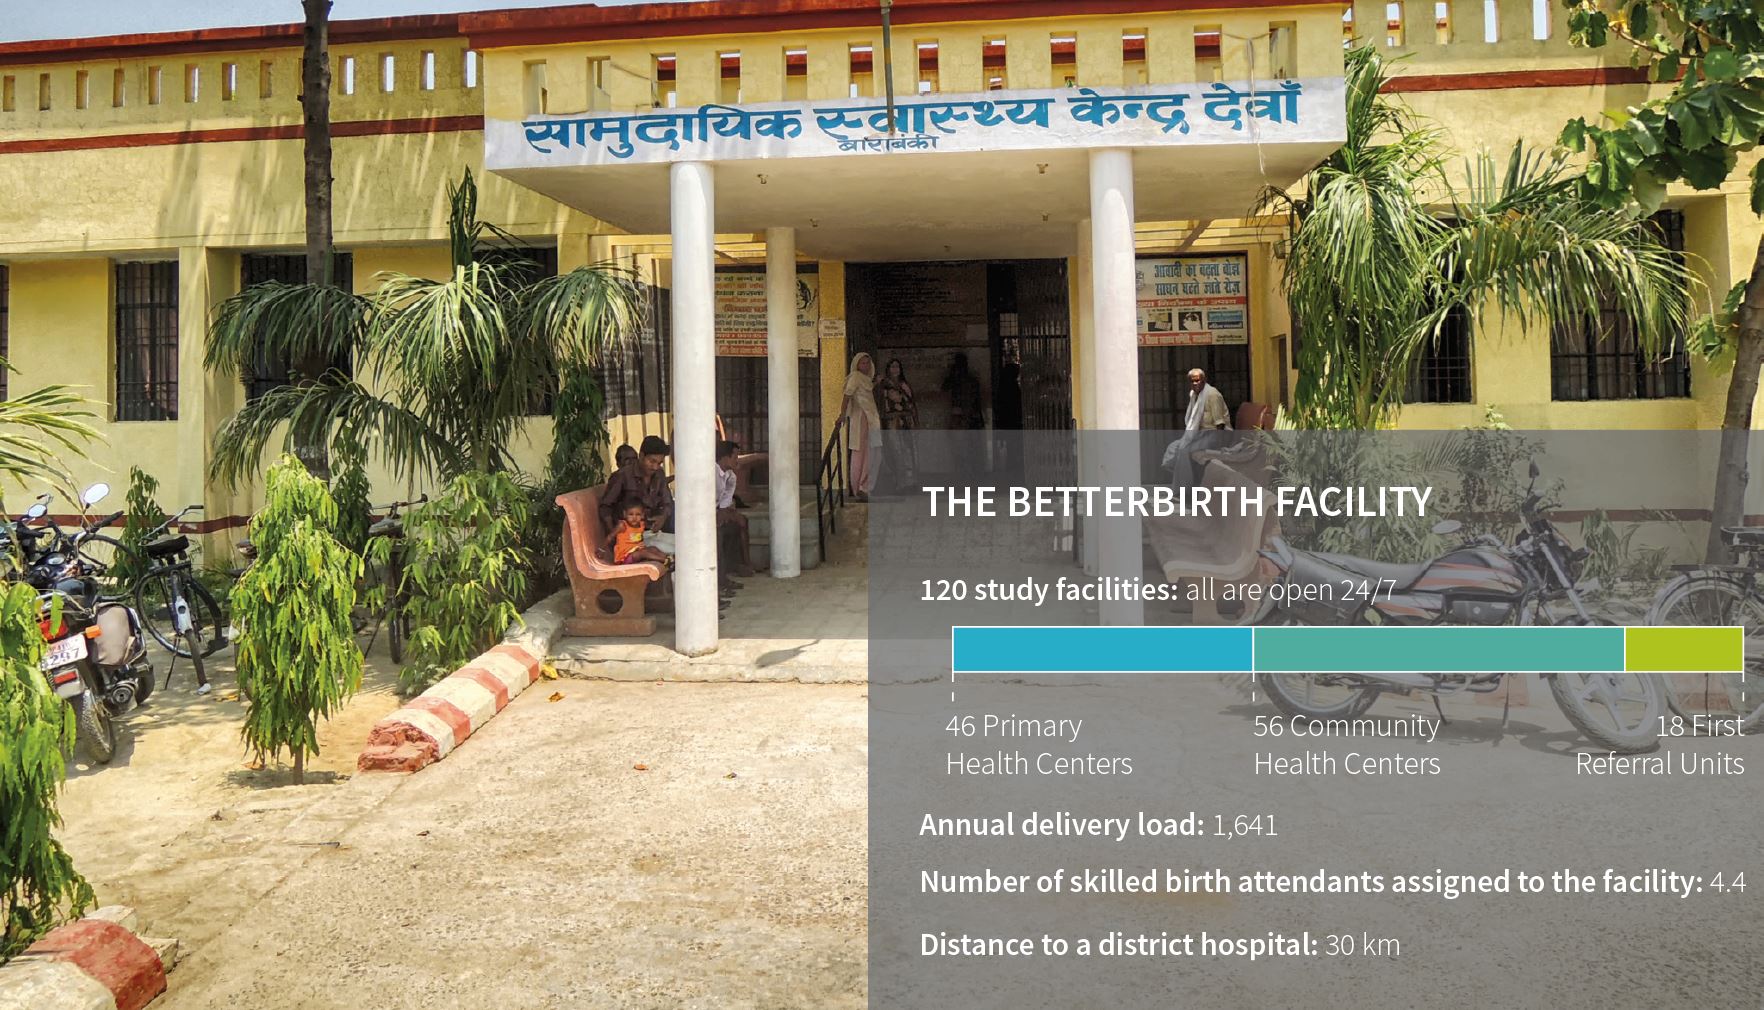
Among our study facilities, the average distance to a district hospital was 30 kilometers. The median time between admission and delivery was 105 minutes, which limited the opportunities for birth attendants to intervene during labor.
While the interval before discharge was not recorded, qualitative interviews suggest that women often left two to six hours after delivery. And although the study’s 18 first-referral facilities were designated to provide comprehensive emergency obstetric and neonatal care, including cesareans, these sites generally did not operate at that level.
What Drives Differences in Intervention Uptake in Facilities?
Despite their apparent similarities, facilities showed dramatic variation in how and whether they integrated and carried out the BetterBirth intervention. In taking on the BetterBirth intervention, the sites clearly operated under differing contexts and degrees of readiness. Moreover, sites were asked to participate in the study and leadership commitment varied.
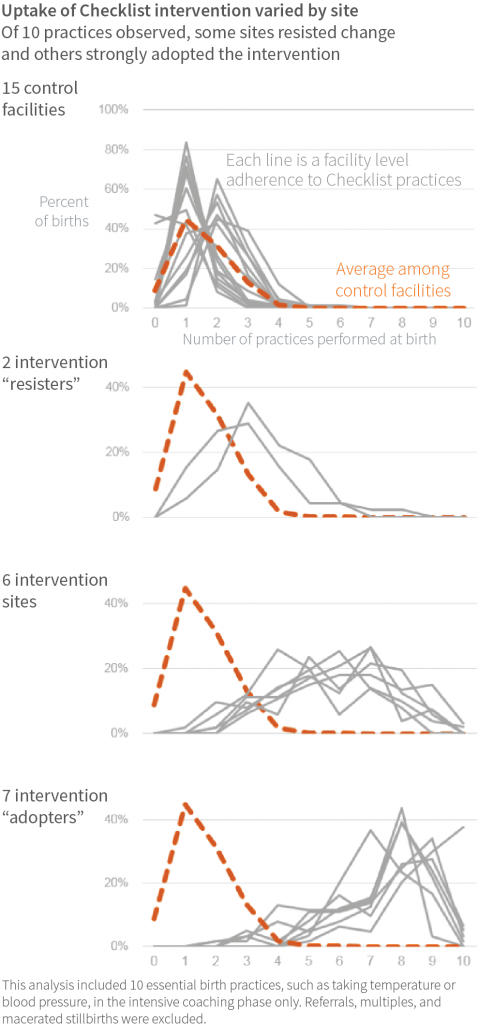
A subset analysis of 15 intervention facilities, where independent observers recorded how closely the staff adhered to intervention behaviors after two months of coaching, showed how thoroughly the intervention was adopted at the facility level (1,259 births observed).
This analysis found that seven facilities were strong adopters, while two largely resisted the intervention. The conventional and easily measured indicators of a facility’s capability for quality improvement—such as supply availability and birth attendant staffing—did not explain the variation in intervention uptake.
One plausible influence on intervention uptake was the support of the facility-level childbirth quality champion in promoting or encouraging quality improvement initiatives. Although it is challenging to measure readiness for quality improvement or leadership effectiveness at these facilities, the study did uncover several telling patterns with regard to turnover.
Leadership turnover was common in the intervention facilities. For example, among the 60 intervention facilities, 18 (30%) experienced a change in head of facility, and five (8%) experienced a change in childbirth quality champion for the BetterBirth intervention.
While turnover among heads of facility was not significantly associated with Checklist behavior adherence or with maternal and neonatal outcomes, facilities with childbirth quality champion turnover tended to have lower mean adherence with essential birth practices. This suggests the consistent presence of a quality improvement champion in a given facility is likely to boost adherence to positive behaviors.
Health Outcomes Also Vary
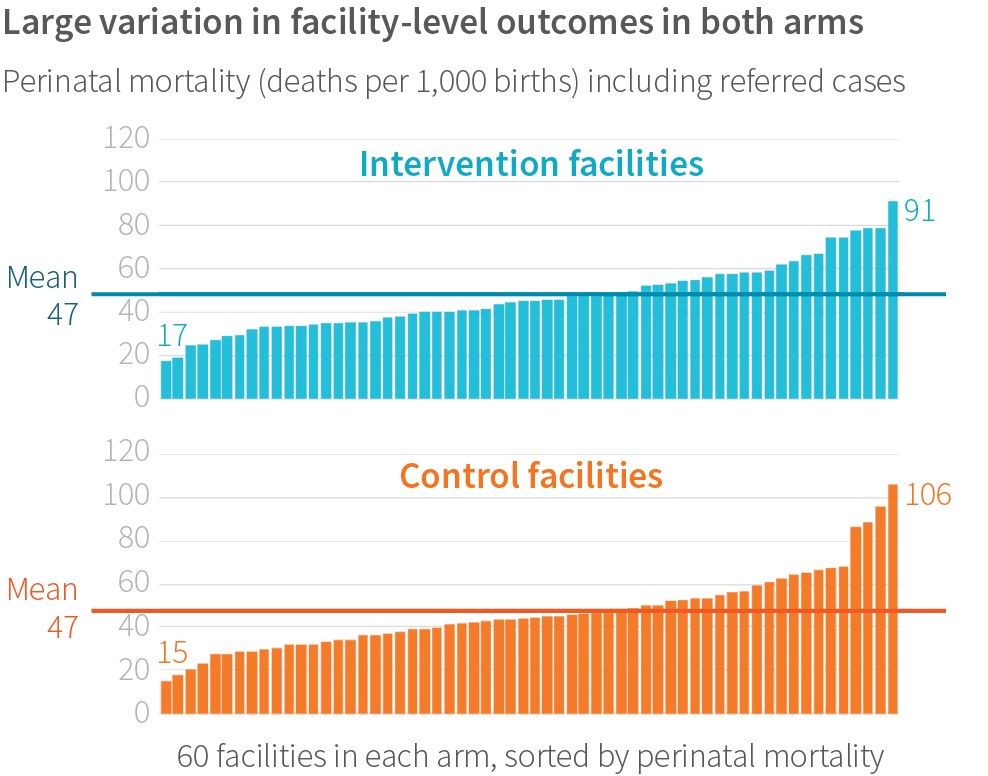
Not only did facilities range widely in how well they adopted the BetterBirth intervention, they also showed remarkable variation in health outcomes. Among the 120 facilities and more than 157,000 births, the study found a seven-fold difference in the perinatal mortality rate across facilities; the lowest-mortality site had 15 deaths per 1,000 births, and the highest-mortality site had 106 deaths per 1,000 births. The maternal mortality ratio ranged from 0 deaths to 471 per 100,000 live births. Severe maternal morbidity ranged from 5% to 33% of women. Referral rates ranged from <1% to 33%, and did not vary across different types of facility (primary health center, community health center, first-referral unit).
What drove this variation in outcomes? Results of the main study showed the intervention did not affect these outcomes generally. However, we found that regardless of study arm, perinatal mortality tended to be lower in births where more birth practices were performed, as opposed to fewer practices. Yet it is unclear if each additional practice contributed independently to lower mortality, or if facilities had some other positive attributes that led to both high adherence to behaviors and low mortality.
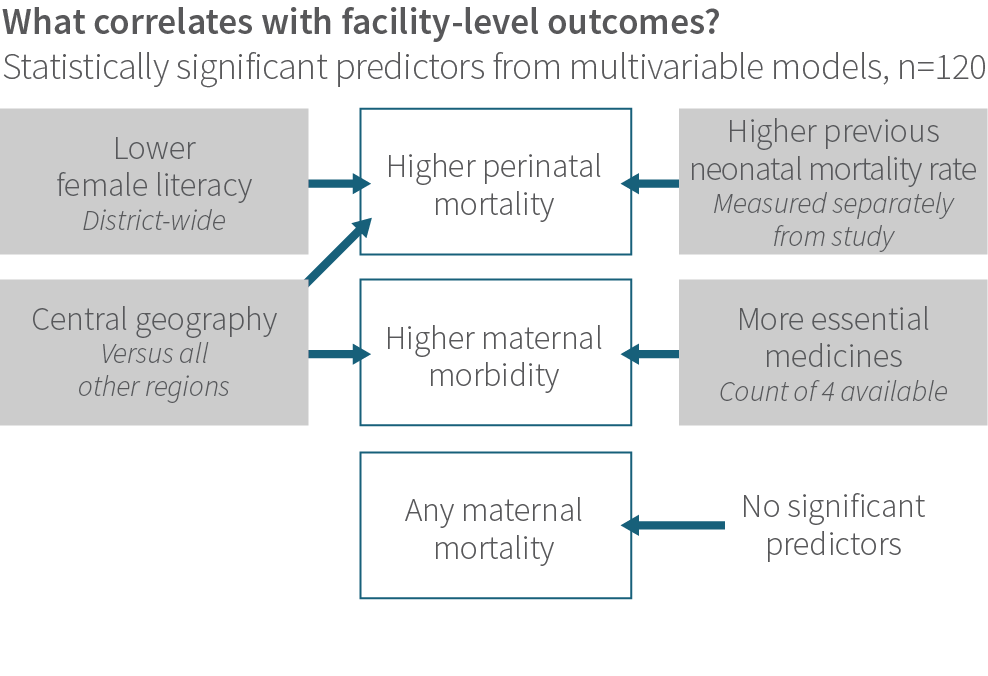
Surprisingly, across all 120 study facilities, traditional care-related factors, such as staffing ratios, facility type, or supply availability, were not consistently associated with health outcomes. Rather, health outcomes were most strongly associated with socioeconomic characteristics.
For example, higher perinatal mortality correlated with lower district-level female literacy, location in the central geographic region of Uttar Pradesh, and a higher previous neonatal mortality rate (as measured with a different method than the study used). Severe maternal morbidity also correlated with central geography, and paradoxically, more supplies of four key birth-related drugs. It is difficult to interpret this finding. It could indicate the medications were sitting untouched on a shelf and not being used to treat patients; or that the medications were being ordered more frequently, used inappropriately, and causing harm; or that facilities with more supplies dealt with a higher volume of patients with complications (whether due to location or because of reputation).
Even among facilities with at least one maternal death, we found no measured facility-level attribute that predicted maternal mortality.
Maternal mortality was rare; 47 of the 120 facilities did not have any maternal deaths during the 12 months of data collection. Even among facilities with at least one maternal death, we found no measured facility-level attribute that predicted maternal mortality.
REGIONAL HUBS
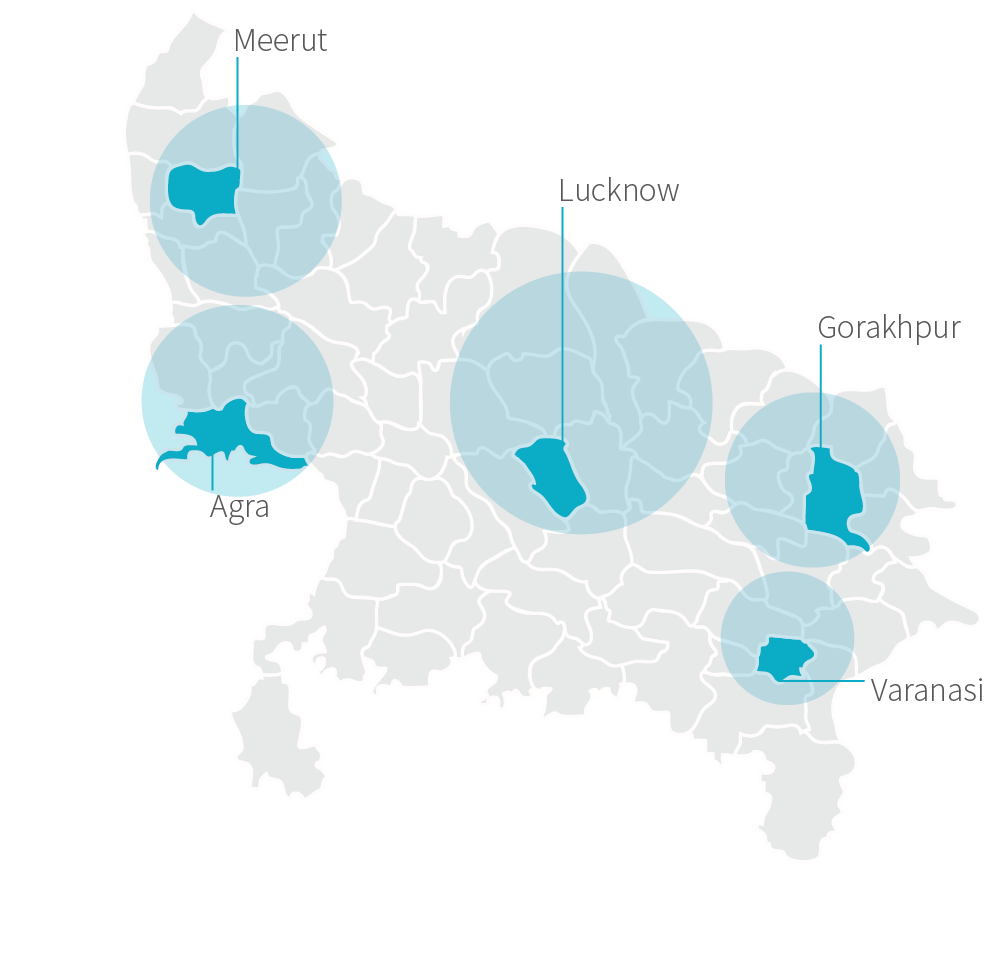
For administrative purposes of the study, we delineated five regional “hubs” throughout Uttar Pradesh: Lucknow, Agra, Varanasi, Gorakhpur, and Meerut. These hubs were created for convenience and included both rural and urban sites. We included “hub” in our statistical model to understand if there were differences in how the program was deployed across regions. While we did find hub (labeled “Central Geography”) to be significant, it is unclear what is driving that difference. It may be due to fundamental differences in the regions we delineated for each hub, or to differences in how the program was implemented.
Referral rates strongly correlated with women reported to have anemia and with women requiring a cesarean delivery; these patterns were not unexpected, given the study’s frontline facilities lacked blood transfusion and surgical capacity.
Aside from these significant relationships, note the characteristics that were not related: a host of typical measures such as staffing levels and staff training, facility type and distance to hospital, age and gravidity of the patient population, and so forth had no relationship to outcomes. This suggests that whatever attribute of facilities is driving the wide difference in outcomes, we did not measure it, or measured it improperly.
Outcome Variation: Under a Magnifying Glass
We wanted to look further into this question. Although the intervention did not change health outcomes in the aggregate, were there certain types of facilities where the intervention did improve outcomes? Although we may not have directly measured what it is about facilities that determines their health outcomes, perhaps we could learn more by examining facilities where the intervention had impact.
We discovered that during the most intensive phase of the intervention, when coaching occurred twice per week, the intervention was associated with lower perinatal mortality in smaller-volume facilities (those that had about 90 births per month), after adjusting for other possible measured characteristics.
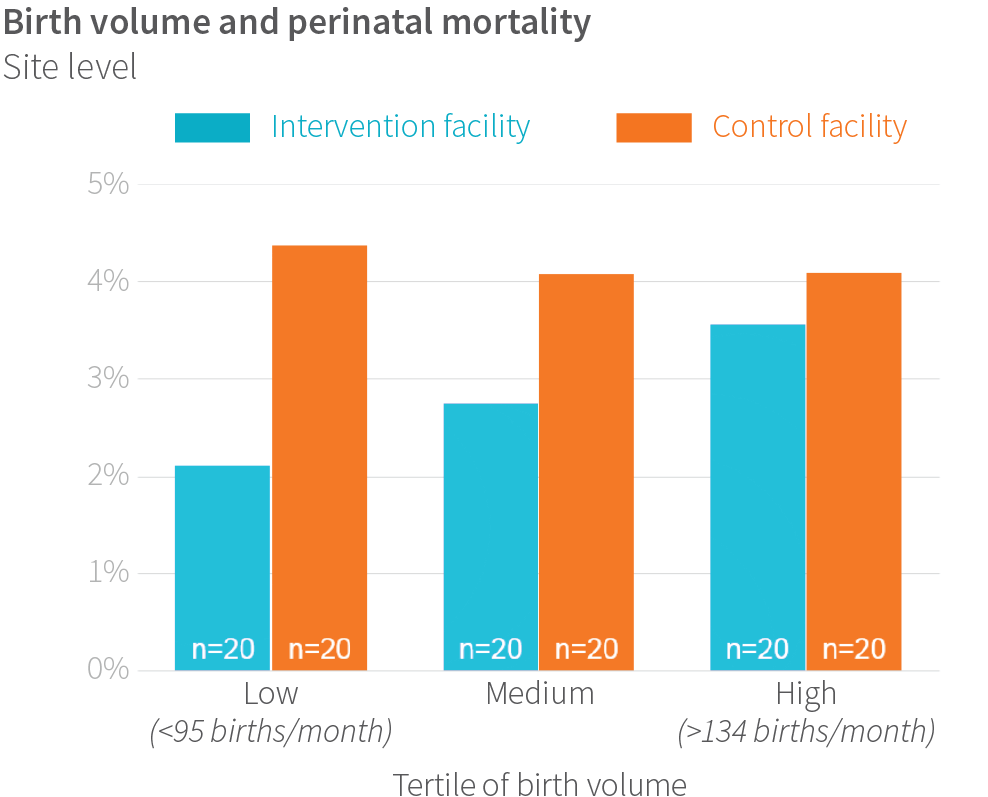
These encouraging trends in lower volume sites may stem from the fact they had more time and space to implement the Safe Childbirth Checklist and other parts of the intervention. Considering the additional cognitive load the 28-item Checklist places upon a birth attendant responsible for multiple clinical and administrative tasks, it is plausible that birth attendants at busier facilities do not have the bandwidth to meaningfully integrate new behaviors into their day-to-day practice.
The superior performance of lower-volume facilities points to the need to better understand how facility work environments and readiness enable them to take on an ambitious quality-improvement intervention.
Strengthening Frontline Facilities: Key Recommendations
Preparing frontline facilities for their many tasks and roles in delivering high-quality childbirth care will require bolstering readiness and leadership. By conducting systematic readiness assessments of capability, capacity, commitment, culture, and context, facilities can identify and fill gaps in carrying out quality-improvement efforts such as the Safe Childbirth Checklist.
Most current readiness assessments do not shed light on the internal and external contexts in which a facility operates. To remedy this problem, reliable assessment instruments for facility readiness should:
- Assess birth attendants’ competency, work roles, and scope of practice.
- Assess the cognitive load for facility staff, including patient volume, and integrate that information into new strategies to smooth the workflow.
- Assess the capacity of facility leaders and staff to carry out quality improvement initiatives. This assessment should consider such factors as staff turnover, staff empowerment, and accountability mechanisms.
- Assess the facility’s physical conditions, such as cleanliness, functional supply chains, and safety.
- Assess the facility’s organizational culture around teamwork and quality improvement.
- Tailor implementation packages to the needs of facility adopters and resisters, and align these packages with the facility’s readiness level.
To optimize facility leadership:
- Draw up plans that ensure smooth operation during leadership turnover, even for a relatively short time span.
- Develop clear processes by which new leaders can quickly grasp ongoing quality initiatives.
- Ensure accountability and oversight to sustain high-quality childbirth care when turnover occurs.
- Provide ongoing support for facility leaders, and safety and quality champions.
- Adopt incentives (financial, status/prestige, training opportunities, recognition, awards) and nurture supportive environments that will help facility leaders and champions thrive.
- Train facility directors in management best practices and leadership competencies. ■